How HAR files can help you
Ever find your self asking "is this a front end bug? or is this a back end bug?" or "I wish I could see what was going on in the network tab of the tester when they found a bug"? Well wish no more introducing .har files.
As a developer, you know how frustrating it can be to track down and fix bugs in your code. Sometimes, the issue may be on your own computer, but other times it may be happening on the user's end. This can make it difficult to pinpoint the exact cause of the problem and find a solution.
One tool that can help you in these situations is the .har file. A .har file (short for HTTP Archive) is a JSON-formatted file that captures detailed information about the interactions between a web browser and a website. This includes the request and response headers, cookies, query string parameters, and more.
With a .har file, you can see exactly what was happening on the user's end when they experienced a bug. This can help you determine if the issue is on the front-end or back-end, and give you valuable insights into what may have caused the problem.
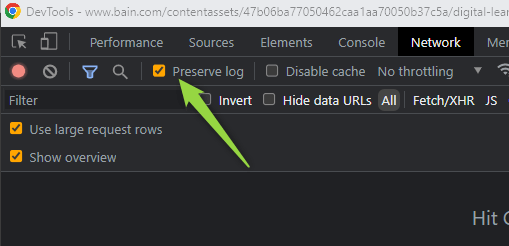
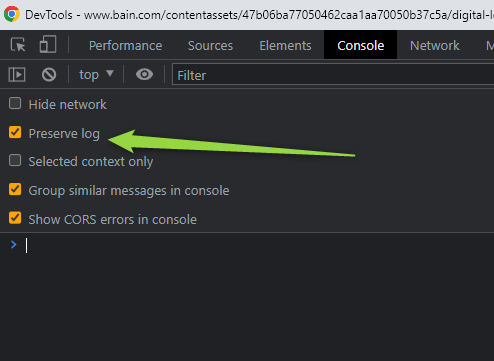
To generate a .har file, you can use the network tab in your web browser's developer tools. first turn on preserve log and network and log tab.


Next simply load the website in question, reproduce the issue, and then save the network log as a . har file

You can then share this file with your team or other developers to help them understand and fix the issue.
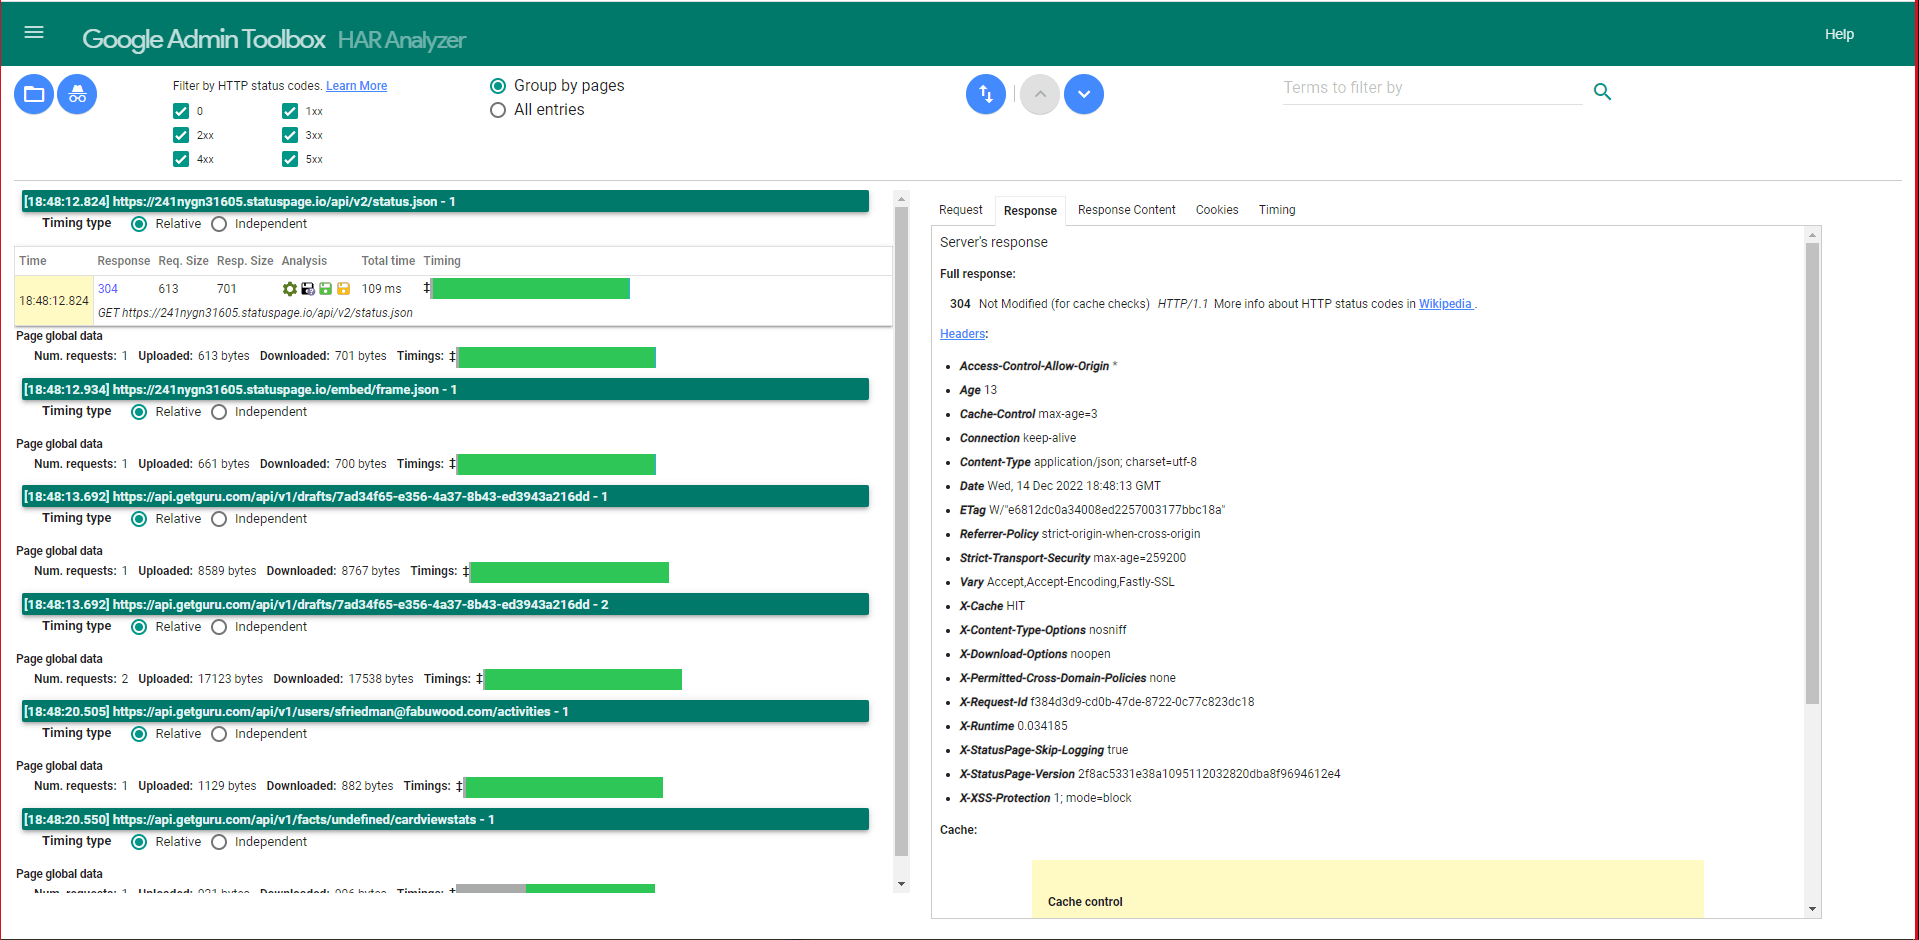
When you get a .har file and want to analyze it, I found that the easiest tool for it would be
har_analyzer
you can also import it in the developer tools.
